Clinical Value of CMR Parametric Mapping: New Criteria for Diagnosing Acute Myocarditis
Korea Univ. Mi-Na Kim
Clinical Value of CMR Parametric Mapping: New Criteria for Diagnosing Acute Myocarditis
J Cardiovasc Imaging 33, 5 (2025)
Acute myocarditis is caused by viral infections, immune responses, or medications, and can lead to serious complications such as heart failure, arrhythmias, dilated cardiomyopathy, and shock. Cardiovascular magnetic resonance (CMR) imaging is widely used as a non-invasive diagnostic tool, and the Modified Lake Louise Criteria (mLLC) revised in 2018 newly incorporated quantitative mapping parameters including native T1, T2 mapping, and extracellular volume (ECV). This study is a recent meta-analysis that comprehensively evaluated the diagnostic performance of these mapping parameters and aimed to determine cut-off values for each mapping parameter in diagnosing acute myocarditis.
Studies published between 2014 and 2024 that diagnosed acute myocarditis through CMR mapping were reviewed, and a total of 11 studies (7 prospective, 4 retrospective) involving 677 patients were included.
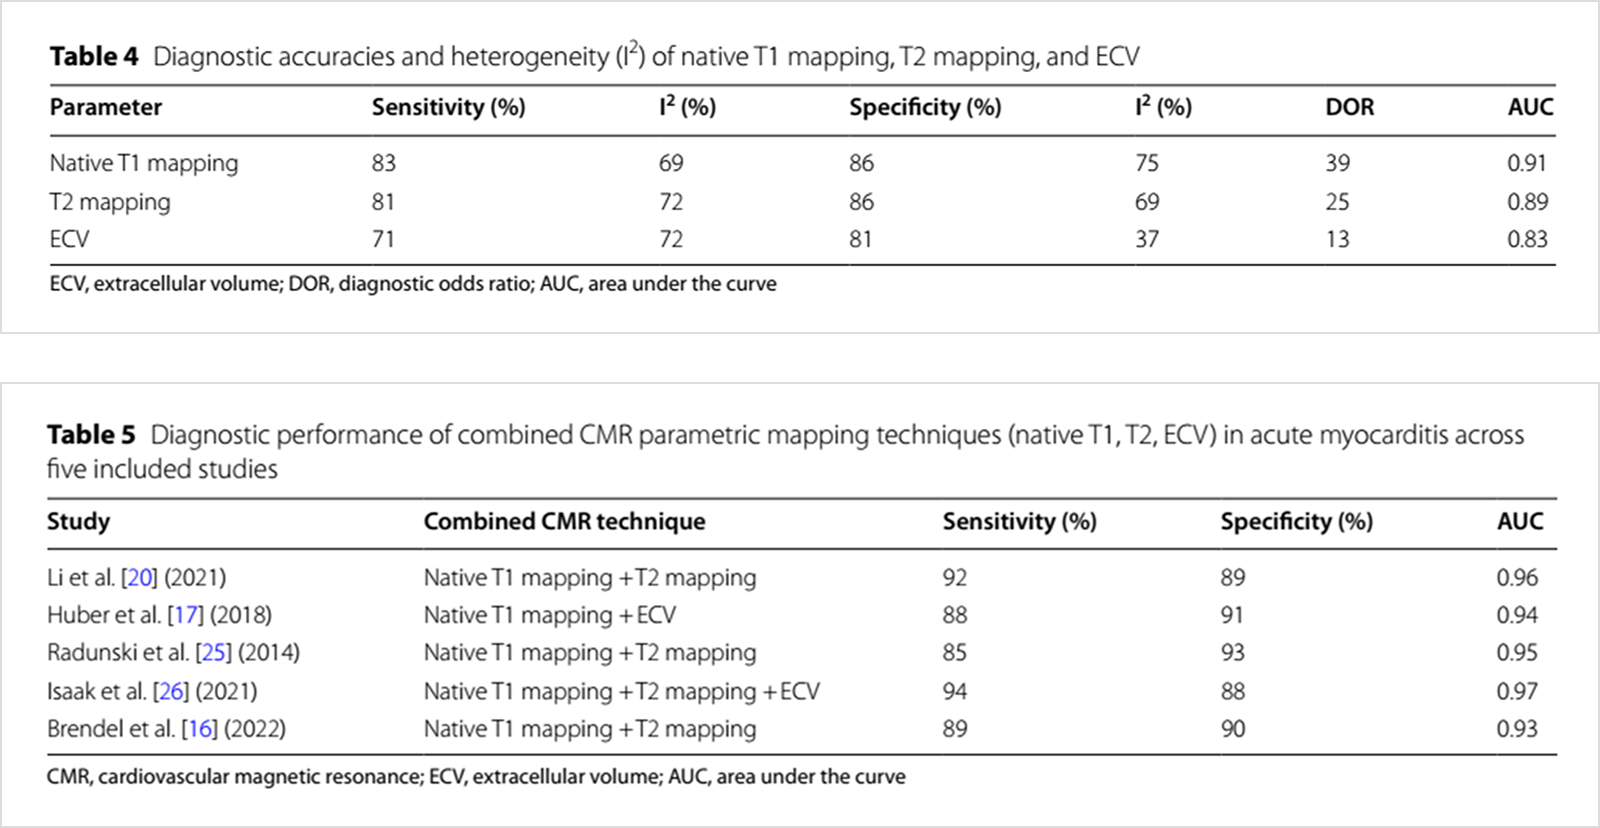
Native T1 mapping showed the highest sensitivity (83%), specificity (86%), and diagnostic accuracy (AUC 0.91). T2 mapping was useful for differentiating the acute phase by reflecting increased water content. ECV was effective in reflecting edema and fibrosis but had somewhat lower sensitivity in the acute phase. The technique combing T1 and T2 or T1 and ECV was superior to single parameters, with an AUC value of 0.94-0.97.
Native T1 mapping showed the highest sensitivity (83%), specificity (86%), and diagnostic accuracy (AUC 0.91). T2 mapping was useful for differentiating the acute phase by reflecting increased water content. ECV was effective in reflecting edema and fibrosis but had somewhat lower sensitivity in the acute phase. The technique combing T1 and T2 or T1 and ECV was superior to single parameters, with an AUC value of 0.94-0.97.
Native T1 mapping showed the highest sensitivity (83%), specificity (86%), and diagnostic accuracy (AUC 0.91). T2 mapping was useful for differentiating the acute phase by reflecting increased water content. ECV was effective in reflecting edema and fibrosis but had somewhat lower sensitivity in the acute phase. The technique combing T1 and T2 or T1 and ECV was superior to single parameters, with an AUC value of 0.94-0.97.